
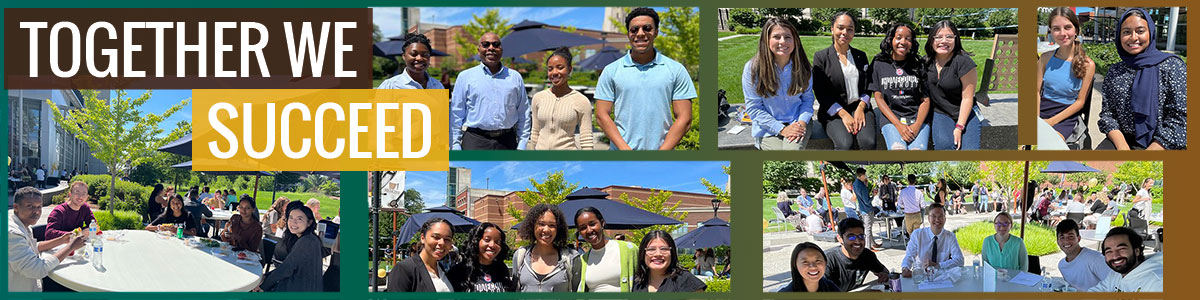
WMed recognizes that achieving our vision of health equity for all in Southwest Michigan requires a culture of belonging and well-being. Students, residents, fellows, faculty, and staff bring a variety of perspectives that enrich the learning and working environment and help shape our culture. Race, ethnicity, and sex influence those perspectives. Publishing this data for full-time enrolled students is required by the Office of Federal Student Aid in the U.S. Department of Education as part of the consumer information disclosures. The data that follows is self-reported as of September 2026, and those who did not report are shown as “not specified.” 2020 US census American Community Survey data for the Southwest Michigan region is provided for comparison.
WMed Composition
There are 2,425 individuals at WMed who are learning, teaching and serving our community, including 343 students, 262 residents and fellows, 159 employed faculty, 535 staff, and 1,126 community faculty.
- Students
Race and Ethnicity
Students Southwest Michigan American Indian or Alaska Native 0% 0.3% Asian 20.1% 2.7% Black or African American 6.1% 11.3% Hispanic or Latino 7.0% 5.6% Native Hawaiian or Other Pacific Islander 0% 0% White 44.3% 73.9% Multi-racial (Two or More Races 20.4% 5.6% Not Specified 2.0% 0.5% Sex
Students Southwest Michigan Female 50.4% 51% Male 48.7% 49% Not Specified 0.9% 0% Total 343 N/A - Employees: Residents, Fellows, Faculty, and Staff
WMed employees report race, ethnicity, and sex in Employee Self Service. All employees are encouraged to enter this information into Employee Self Service to support our culture of belonging and well-being.
Race and Ethnicity
Residents and Fellows Faculty Staff Southwest Michigan Total 262 159 535 N/A American Indian or Alaska Native 0% 0% 0.4% 0.3% Asian 11.5% 8.2% 1.9% 2.7% Black or African American 5.3% 3.8% 2.4% 11.3% Hispanic or Latino 0% 1.3% 0.7% 5.6% Native Hawaiian or Other Pacific Islander 0% 0% 0.2% 0% White 23.7% 66% 59.3% 73.9% Multiracial (Two or More Races) 1.1% 2.5% 2.6% 5.6% Not Specified 58.4% 18.2% 32.5% 0.5% Sex
Residents and Fellows Faculty Staff Southwest Michigan Female 53% 45.9% 70.3% 51% Male 47% 51.6% 27.3% 49% Not Specified 0% 2.5% 2.4% N/A Total 262 159 563 N/A - Community Faculty
Community faculty are not employed by the medical school but hold a faculty appointment in one of our academic departments.
Race and Ethnicity
Community Faculty Southwest Michigan Total 1,126 N/A American Indian or Alaska Native 0% 0.3% Asian 3.5% 2.7% Black or African American 0.6% 11.3% Hispanic or Latino 0.4% 5.6% Native Hawaiian or Other Pacific Islander 0.1% 0% White 34.3% 73.9% Multiracial (Two or More Races) 0.4% 5.6% Not Specified 60.7% 0.5% Sex
Community Faculty Southwest Michigan Female 29.3% 51% Male 57.1% 49% Not Specified 13.6% 0% Total 1,126 N/A
Updated: September 28, 2026; data reported as of September 2026